FAZ Segmentation
Fovea region of the human retina for high resolution vision. Within fovea is a region devoid from retinal vessels called Fovea Avascular Zone (FAZ) where the light is sensed without loss or distortions. While the FAZ shape and size may vary widely in normal human eyes, certain changes of shape and size of the FAZ are related to developmental events and injury or disease before birth, during infancy, or later stages in life; and these may cause loss of vision. To understand the effects of retinal diseases on the FAZ, it is essential first to measure the FAZ area accurately.
FAZ was first measured on fluorescein angiographic images which required intravenous dye injection. Many computerized techniques have been developed to identify the FAZ area on fundus fluorescein angiography (FFA) images, such as Genetic snake [1], Bayesian statistical [2], region-growing–based [3], and level-set method [4]. However due to [drawback of the FFA method], FFA use has been limited.
Optical coherence tomography angiography (OCTA) is a newly, noninvasive, and dye-less imaging technique for evaluating the vessels by capturing the dynamic motion of the erythrocytes, and has been shown to be a useful imaging modality for evaluation of ophthalmologic diseases [5] . OCTA provides many advantages over FFA] and thus hold many promises to further researches and clinical uses.
Because of OCTA novelty, hand labelling is still a predominant method for FAZ segmentation. Manual segmentation, on one hand, remained a ponderous task, requiring hours of laborious marking over OCTA image. On the other hand, automatic FAZ segmentation by commercialized OCTA system has been shown much less effective than human labelling [6]. Moreover, there has not been much an agreement between current different OCTA analysis systems [cite]. The algorithms used in the commercially-available OCTA instruments are developed independently, leading to different FAZ segmentation results that might not be interchangeable. For those reasons, it is of paramount to devise an effective and stable FAZ segmentation system.
Santosh et al presented a fully automated local fractal dimension method [7] to quantify vessel density and FAZ area in OCTA images and stated that it can be used to detect abnormalities in the superficial and deep retinal plexuses as well as in the outer retina and choroid layers. Recently, authors in [8] presented use of generalized gradient vector flow (GGVF) snake model in identifying FAZ. These studies successfully demonstrated that
However, we observes that most ongoing researches on algorithm FAZ segmentation algorithms suffer one major problem. The evaluating metrics for image segmentation result are quite simple and in our view, not sufficient to verify its validity. Most studies rely on FAZ area due to its clinical interpretation, however, area does not guarantee similarity between the automatic and manual segmentation. On the contrary, if the similarity is confirmed, it is highly likely that two area values would agree.
In this study, we present (i) a novel method for automatic FAZ segmentation that achieved comparable results with manual labelling and better performance than previous studies and (ii) a more comprehensive and more adequate evaluation framework for assessing FAZ segmentation algorithm. We adopted Hessian filter and Level Set for FAZ segmentation. The method has been widely used and frequently used in the domain of neural imaging. However, the usage of this method on OCTA, especially in FAZ segmentation, is yet to be explored.
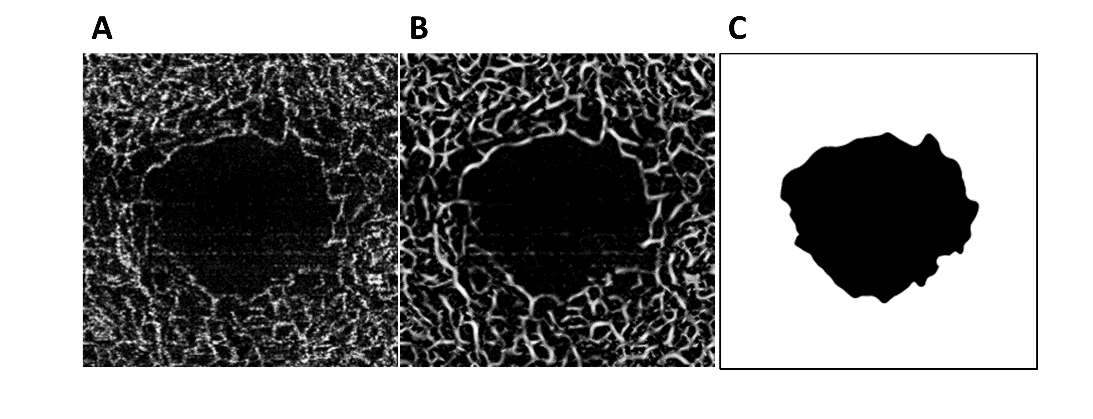
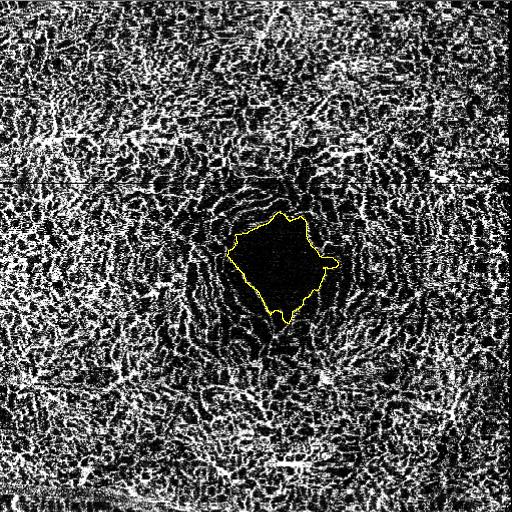
The system was developed and tested on a dataset of 30 OCTA retinal DVC images. A Hessian based filter is firstly applied to enhance the vascular structures and to suppress non-vascular structures and image noise. The automated segmentation results were compared to two independent manual segmentation results to evaluate the performance of the system.
Our segmentation tool was able to achieved more than 90% of all measurements with small variances. Only 3 out of 30 was lower than 90%, but still higher than 80%, with an exception of 79.9%. Since there has been a standard threshold for a good segmented image, the results from our study suggested only with Jaccard coefficient higher than 90%, an segmented image can be deemed qualified for further analysis.
References
[1] L. Ballerini, “Genetic Snakes for Medical Images Segmentation,” Springer, Berlin, Heidelberg, 1999, pp. 59–73.
[2] M. V. Ibañez and A. Simó, “Bayesian detection of the fovea in eye fundus angiographies,” Pattern Recognit. Lett., vol. 20, no. 2, pp. 229–240, Feb. 1999.
[3] J. Conrath et al., “Semi-automated detection of the foveal avascular zone in fluorescein angiograms in diabetes mellitus,” Clin. Exp. Ophthalmol., vol. 34, no. 2, pp. 119–123, Mar. 2006.
[4] Y. Zheng, J. S. Gandhi, A. N. Stangos, C. Campa, D. M. Broadbent, and S. P. Harding, “Automated Segmentation of Foveal Avascular Zone in Fundus Fluorescein Angiography,” Investig. Opthalmology Vis. Sci., vol. 51, no. 7, p. 3653, Jul. 2010.
[5] T. E. de Carlo, A. Romano, N. K. Waheed, and J. S. Duker, “A review of optical coherence tomography angiography (OCTA),” Int. J. Retin. Vitr., vol. 1, no. 1, p. 5, Apr. 2015.
[6] R. Linderman, A. E. Salmon, M. Strampe, M. Russillo, J. Khan, and J. Carroll, “Assessing the Accuracy of Foveal Avascular Zone Measurements Using Optical Coherence Tomography Angiography: Segmentation and Scaling.,” Transl. Vis. Sci. Technol., vol. 6, no. 3, p. 16, Jun. 2017.
[7] S. G. K. Gadde et al., “Quantification of Vessel Density in Retinal Optical Coherence Tomography Angiography Images Using Local Fractal Dimension,” Investig. Opthalmology Vis. Sci., vol. 57, no. 1, p. 246, Jan. 2016.
[8] Y. Lu et al., “Evaluation of Automatically Quantified Foveal Avascular Zone Metrics for Diagnosis of Diabetic Retinopathy Using Optical Coherence Tomography Angiography,” Investig. Opthalmology Vis. Sci., vol. 59, no. 6, p. 2212, May 2018.